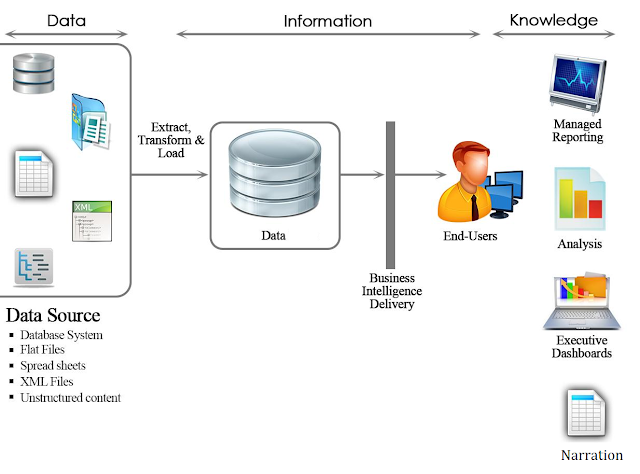
Harrier has successfully delivered several projects on business intelligence using tools like PowerBI, HighCharts and Tableau.
Below are the two common challenges we often faced during these projects:-
1. On the input side, getting raw data into the system from multiple sources with least manual intervention.
2. On the output side, narrating the insights gleaned from the data presented on the dashboards generated using the BI tool.
We recently found solutions to both these issues using latest tools from different organizations using artificial intelligence.
The first challenge on the data input can be addressed by OCR and image processing tool from AWS, that help extract text from images! It’s called Rekognition …
https://aws.amazon.com/rekognition/
Once we get the raw data in, and come up with dashboards using a
Business Intelligence tool, we can also narrate the insights to help user comprehend the information using auto-generated narration from Narrative Science …
https://narrativescience.com/. It also has a widget in PowerBI to automatically interpret the dashboards for you.
We have already implemented PoC in a couple of scenarios and it works well. We shall be happy to help you put life into your data using this combination of three different tools working in harmonious orchestration.


